This function takes in an object of class simmr_output and creates
probabilistic comparisons between the supplied sources. The group number can
also be specified.
compare_sources(
  simmr_out,
  source_names = simmr_out$input$source_names,
  group = 1,
  plot = TRUE
)
Arguments
- simmr_out
An object of class
simmr_outputcreated fromsimmr_mcmcorsimmr_ffvb.- source_names
The names of at least two sources. These should match the names exactly given to
simmr_load.- group
The integer values of the group numbers to be compared. If not specified assumes the first or only group
- plot
A logical value specifying whether plots should be produced or not.
Value
If there are two sources, a vector containing the differences between the two dietary proportion proportions for these two sources. If there are multiple sources, a list containing the following fields:
- Ordering
The different possible orderings of the dietary proportions across sources
- out_all
The dietary proportions for these sources specified as columns in a matrix
Details
When two sources are specified, the function produces a direct calculation of the probability that the dietary proportion for one source is bigger than the other. When more than two sources are given, the function produces a set of most likely probabilistic orderings for each combination of sources. The function produces boxplots by default and also allows for the storage of the output for further analysis if required.
See also
See simmr_mcmc for complete examples.
Examples
# \donttest{
data(geese_data_day1)
simmr_1 <- with(
geese_data_day1,
simmr_load(
mixtures = mixtures,
source_names = source_names,
source_means = source_means,
source_sds = source_sds,
correction_means = correction_means,
correction_sds = correction_sds,
concentration_means = concentration_means
)
)
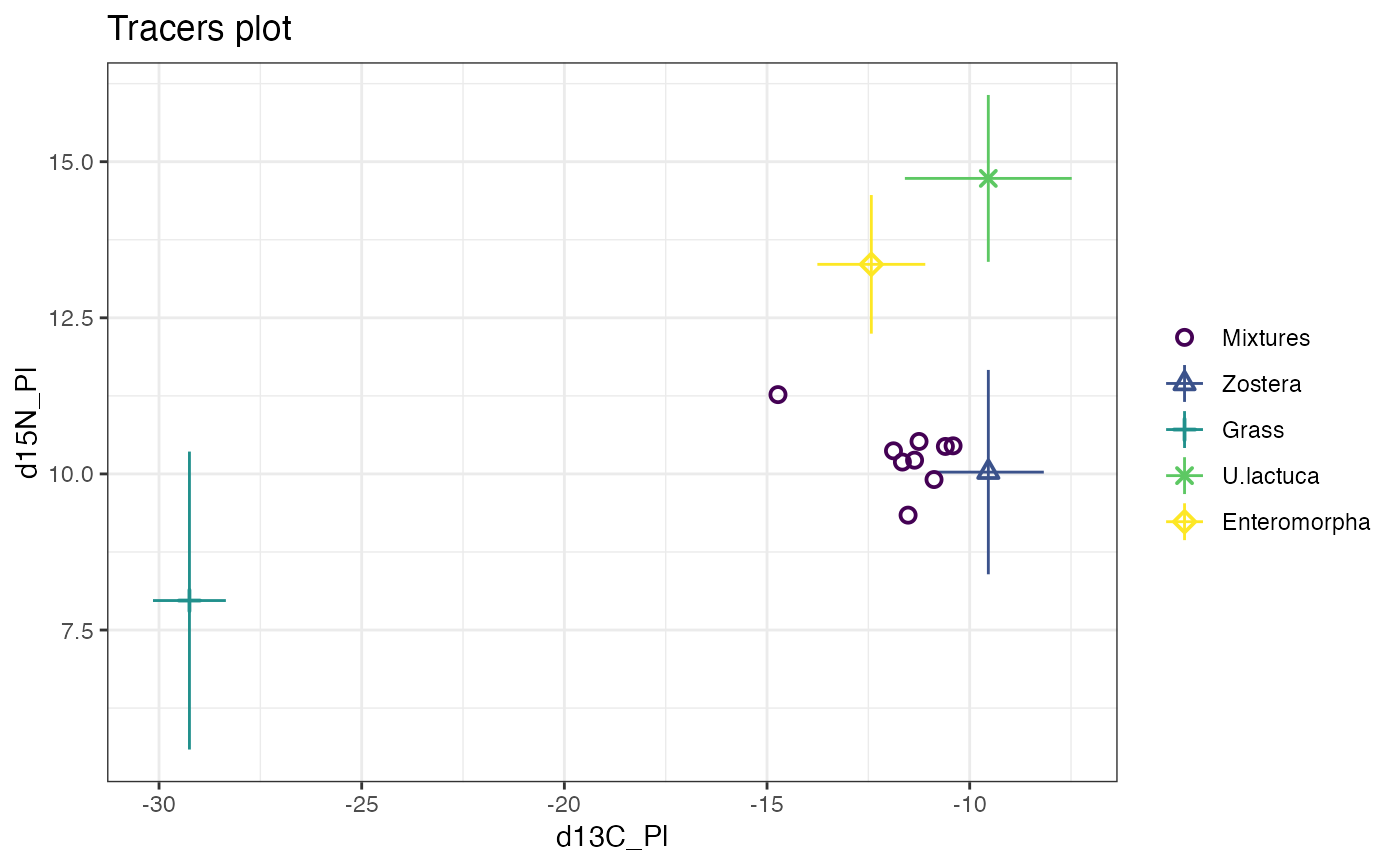
# Plot
plot(simmr_1)
 # Print
simmr_1
#> This is a valid simmr input object with
#> 9 observations,
#> 2 tracers, and
#> 4 sources.
#> The source names are:
#> [1] "Zostera" "Grass" "U.lactuca" "Enteromorpha"
#> .
#> The tracer names are:
#> [1] "d13C_Pl" "d15N_Pl"
#>
#>
# MCMC run
simmr_1_out <- simmr_mcmc(simmr_1)
#> Compiling model graph
#> Resolving undeclared variables
#> Allocating nodes
#> Graph information:
#> Observed stochastic nodes: 18
#> Unobserved stochastic nodes: 6
#> Total graph size: 136
#>
#> Initializing model
#>
# Print it
print(simmr_1_out)
#> This is a valid simmr input object with
#> 9 observations,
#> 2 tracers, and
#> 4 sources.
#> The source names are:
#> [1] "Zostera" "Grass" "U.lactuca" "Enteromorpha"
#> .
#> The tracer names are:
#> [1] "d13C_Pl" "d15N_Pl"
#>
#>
#> The input data has been run via simmr_mcmc and has produced
#> 3600 iterations over 4 MCMC chains.
#>
#>
# Summary
summary(simmr_1_out)
#>
#> Summary for 1
#> R-hat values - these values should all be close to 1.
#> If not, try a longer run of simmr_mcmc.
#> deviance Zostera Grass U.lactuca Enteromorpha sd[d13C_Pl]
#> 1 1 1 1 1 1
#> sd[d15N_Pl]
#> 1
#> 2.5% 25% 50% 75% 97.5%
#> deviance 52.830 56.502 59.569 63.547 73.984
#> Zostera 0.341 0.501 0.586 0.669 0.820
#> Grass 0.029 0.058 0.075 0.093 0.140
#> U.lactuca 0.020 0.078 0.134 0.206 0.384
#> Enteromorpha 0.022 0.090 0.165 0.266 0.472
#> sd[d13C_Pl] 0.543 1.126 1.542 2.126 3.989
#> sd[d15N_Pl] 0.267 0.660 0.956 1.362 2.647
#> mean sd
#> deviance 60.574 5.599
#> Zostera 0.582 0.122
#> Grass 0.077 0.028
#> U.lactuca 0.152 0.098
#> Enteromorpha 0.189 0.123
#> sd[d13C_Pl] 1.732 0.973
#> sd[d15N_Pl] 1.085 0.637
#> deviance Zostera Grass U.lactuca Enteromorpha sd[d13C_Pl]
#> deviance 1.000 -0.277 0.171 0.217 0.063 0.657
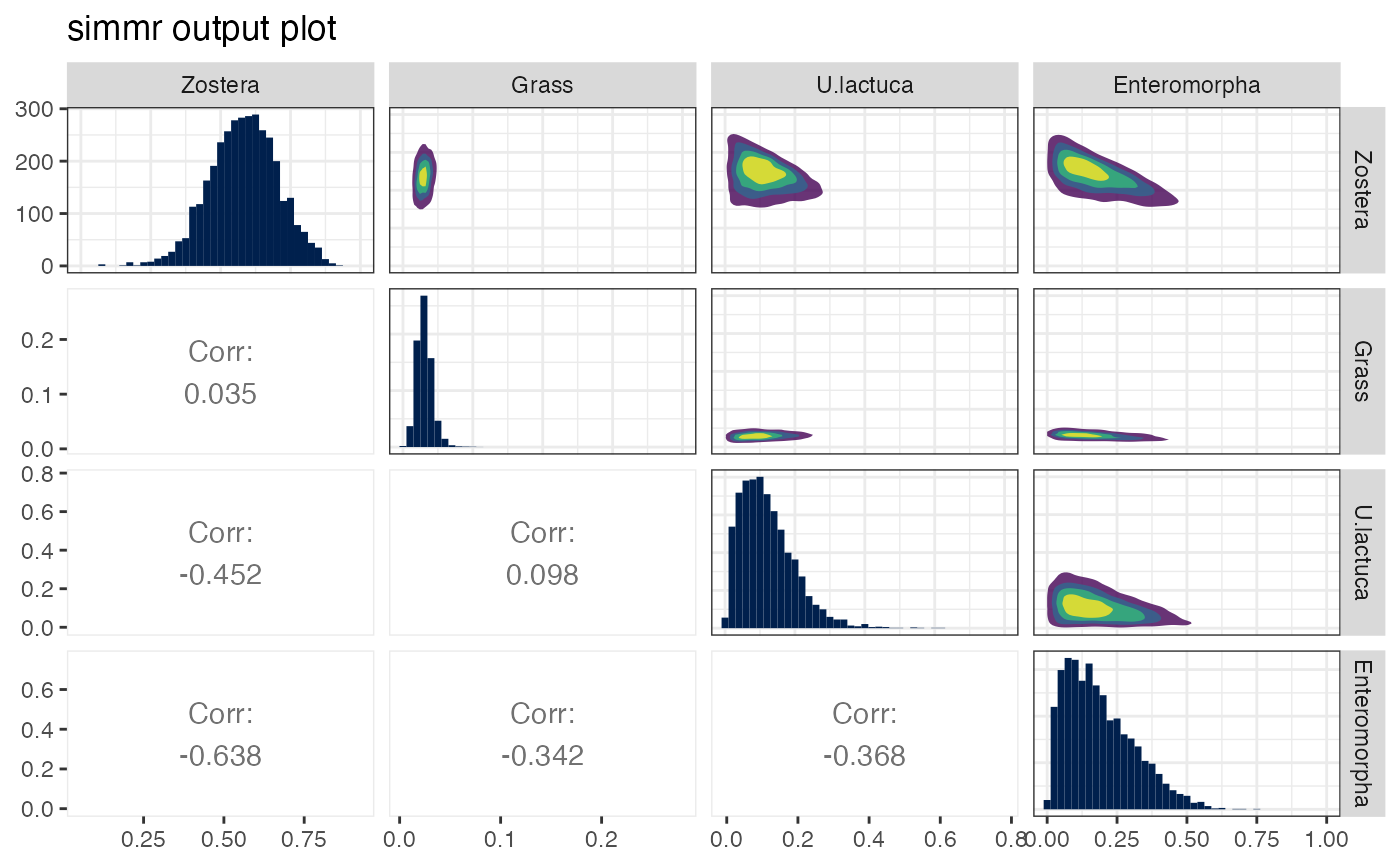
#> Zostera -0.277 1.000 0.035 -0.452 -0.638 -0.126
#> Grass 0.171 0.035 1.000 0.098 -0.342 0.308
#> U.lactuca 0.217 -0.452 0.098 1.000 -0.368 0.023
#> Enteromorpha 0.063 -0.638 -0.342 -0.368 1.000 0.036
#> sd[d13C_Pl] 0.657 -0.126 0.308 0.023 0.036 1.000
#> sd[d15N_Pl] 0.659 -0.193 -0.102 0.175 0.076 -0.014
#> sd[d15N_Pl]
#> deviance 0.659
#> Zostera -0.193
#> Grass -0.102
#> U.lactuca 0.175
#> Enteromorpha 0.076
#> sd[d13C_Pl] -0.014
#> sd[d15N_Pl] 1.000
summary(simmr_1_out, type = "diagnostics")
#>
#> Summary for 1
#> R-hat values - these values should all be close to 1.
#> If not, try a longer run of simmr_mcmc.
#> deviance Zostera Grass U.lactuca Enteromorpha sd[d13C_Pl]
#> 1 1 1 1 1 1
#> sd[d15N_Pl]
#> 1
summary(simmr_1_out, type = "correlations")
#>
#> Summary for 1
#> deviance Zostera Grass U.lactuca Enteromorpha sd[d13C_Pl]
#> deviance 1.000 -0.277 0.171 0.217 0.063 0.657
#> Zostera -0.277 1.000 0.035 -0.452 -0.638 -0.126
#> Grass 0.171 0.035 1.000 0.098 -0.342 0.308
#> U.lactuca 0.217 -0.452 0.098 1.000 -0.368 0.023
#> Enteromorpha 0.063 -0.638 -0.342 -0.368 1.000 0.036
#> sd[d13C_Pl] 0.657 -0.126 0.308 0.023 0.036 1.000
#> sd[d15N_Pl] 0.659 -0.193 -0.102 0.175 0.076 -0.014
#> sd[d15N_Pl]
#> deviance 0.659
#> Zostera -0.193
#> Grass -0.102
#> U.lactuca 0.175
#> Enteromorpha 0.076
#> sd[d13C_Pl] -0.014
#> sd[d15N_Pl] 1.000
summary(simmr_1_out, type = "statistics")
#>
#> Summary for 1
#> mean sd
#> deviance 60.574 5.599
#> Zostera 0.582 0.122
#> Grass 0.077 0.028
#> U.lactuca 0.152 0.098
#> Enteromorpha 0.189 0.123
#> sd[d13C_Pl] 1.732 0.973
#> sd[d15N_Pl] 1.085 0.637
ans <- summary(simmr_1_out, type = c("quantiles", "statistics"))
#>
#> Summary for 1
#> 2.5% 25% 50% 75% 97.5%
#> deviance 52.830 56.502 59.569 63.547 73.984
#> Zostera 0.341 0.501 0.586 0.669 0.820
#> Grass 0.029 0.058 0.075 0.093 0.140
#> U.lactuca 0.020 0.078 0.134 0.206 0.384
#> Enteromorpha 0.022 0.090 0.165 0.266 0.472
#> sd[d13C_Pl] 0.543 1.126 1.542 2.126 3.989
#> sd[d15N_Pl] 0.267 0.660 0.956 1.362 2.647
#> mean sd
#> deviance 60.574 5.599
#> Zostera 0.582 0.122
#> Grass 0.077 0.028
#> U.lactuca 0.152 0.098
#> Enteromorpha 0.189 0.123
#> sd[d13C_Pl] 1.732 0.973
#> sd[d15N_Pl] 1.085 0.637
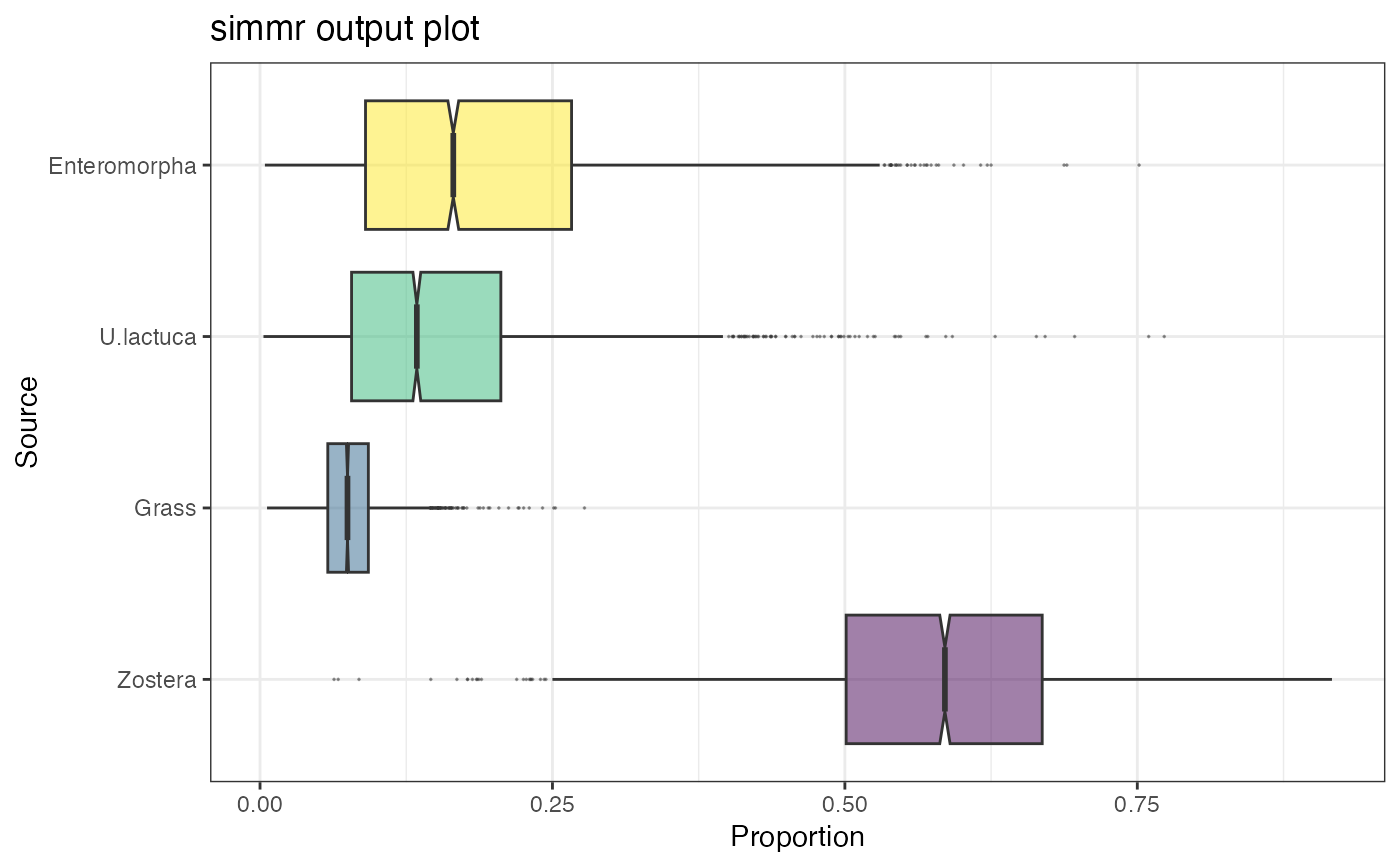
# Plot
plot(simmr_1_out, type = "boxplot")
# Print
simmr_1
#> This is a valid simmr input object with
#> 9 observations,
#> 2 tracers, and
#> 4 sources.
#> The source names are:
#> [1] "Zostera" "Grass" "U.lactuca" "Enteromorpha"
#> .
#> The tracer names are:
#> [1] "d13C_Pl" "d15N_Pl"
#>
#>
# MCMC run
simmr_1_out <- simmr_mcmc(simmr_1)
#> Compiling model graph
#> Resolving undeclared variables
#> Allocating nodes
#> Graph information:
#> Observed stochastic nodes: 18
#> Unobserved stochastic nodes: 6
#> Total graph size: 136
#>
#> Initializing model
#>
# Print it
print(simmr_1_out)
#> This is a valid simmr input object with
#> 9 observations,
#> 2 tracers, and
#> 4 sources.
#> The source names are:
#> [1] "Zostera" "Grass" "U.lactuca" "Enteromorpha"
#> .
#> The tracer names are:
#> [1] "d13C_Pl" "d15N_Pl"
#>
#>
#> The input data has been run via simmr_mcmc and has produced
#> 3600 iterations over 4 MCMC chains.
#>
#>
# Summary
summary(simmr_1_out)
#>
#> Summary for 1
#> R-hat values - these values should all be close to 1.
#> If not, try a longer run of simmr_mcmc.
#> deviance Zostera Grass U.lactuca Enteromorpha sd[d13C_Pl]
#> 1 1 1 1 1 1
#> sd[d15N_Pl]
#> 1
#> 2.5% 25% 50% 75% 97.5%
#> deviance 52.830 56.502 59.569 63.547 73.984
#> Zostera 0.341 0.501 0.586 0.669 0.820
#> Grass 0.029 0.058 0.075 0.093 0.140
#> U.lactuca 0.020 0.078 0.134 0.206 0.384
#> Enteromorpha 0.022 0.090 0.165 0.266 0.472
#> sd[d13C_Pl] 0.543 1.126 1.542 2.126 3.989
#> sd[d15N_Pl] 0.267 0.660 0.956 1.362 2.647
#> mean sd
#> deviance 60.574 5.599
#> Zostera 0.582 0.122
#> Grass 0.077 0.028
#> U.lactuca 0.152 0.098
#> Enteromorpha 0.189 0.123
#> sd[d13C_Pl] 1.732 0.973
#> sd[d15N_Pl] 1.085 0.637
#> deviance Zostera Grass U.lactuca Enteromorpha sd[d13C_Pl]
#> deviance 1.000 -0.277 0.171 0.217 0.063 0.657
#> Zostera -0.277 1.000 0.035 -0.452 -0.638 -0.126
#> Grass 0.171 0.035 1.000 0.098 -0.342 0.308
#> U.lactuca 0.217 -0.452 0.098 1.000 -0.368 0.023
#> Enteromorpha 0.063 -0.638 -0.342 -0.368 1.000 0.036
#> sd[d13C_Pl] 0.657 -0.126 0.308 0.023 0.036 1.000
#> sd[d15N_Pl] 0.659 -0.193 -0.102 0.175 0.076 -0.014
#> sd[d15N_Pl]
#> deviance 0.659
#> Zostera -0.193
#> Grass -0.102
#> U.lactuca 0.175
#> Enteromorpha 0.076
#> sd[d13C_Pl] -0.014
#> sd[d15N_Pl] 1.000
summary(simmr_1_out, type = "diagnostics")
#>
#> Summary for 1
#> R-hat values - these values should all be close to 1.
#> If not, try a longer run of simmr_mcmc.
#> deviance Zostera Grass U.lactuca Enteromorpha sd[d13C_Pl]
#> 1 1 1 1 1 1
#> sd[d15N_Pl]
#> 1
summary(simmr_1_out, type = "correlations")
#>
#> Summary for 1
#> deviance Zostera Grass U.lactuca Enteromorpha sd[d13C_Pl]
#> deviance 1.000 -0.277 0.171 0.217 0.063 0.657
#> Zostera -0.277 1.000 0.035 -0.452 -0.638 -0.126
#> Grass 0.171 0.035 1.000 0.098 -0.342 0.308
#> U.lactuca 0.217 -0.452 0.098 1.000 -0.368 0.023
#> Enteromorpha 0.063 -0.638 -0.342 -0.368 1.000 0.036
#> sd[d13C_Pl] 0.657 -0.126 0.308 0.023 0.036 1.000
#> sd[d15N_Pl] 0.659 -0.193 -0.102 0.175 0.076 -0.014
#> sd[d15N_Pl]
#> deviance 0.659
#> Zostera -0.193
#> Grass -0.102
#> U.lactuca 0.175
#> Enteromorpha 0.076
#> sd[d13C_Pl] -0.014
#> sd[d15N_Pl] 1.000
summary(simmr_1_out, type = "statistics")
#>
#> Summary for 1
#> mean sd
#> deviance 60.574 5.599
#> Zostera 0.582 0.122
#> Grass 0.077 0.028
#> U.lactuca 0.152 0.098
#> Enteromorpha 0.189 0.123
#> sd[d13C_Pl] 1.732 0.973
#> sd[d15N_Pl] 1.085 0.637
ans <- summary(simmr_1_out, type = c("quantiles", "statistics"))
#>
#> Summary for 1
#> 2.5% 25% 50% 75% 97.5%
#> deviance 52.830 56.502 59.569 63.547 73.984
#> Zostera 0.341 0.501 0.586 0.669 0.820
#> Grass 0.029 0.058 0.075 0.093 0.140
#> U.lactuca 0.020 0.078 0.134 0.206 0.384
#> Enteromorpha 0.022 0.090 0.165 0.266 0.472
#> sd[d13C_Pl] 0.543 1.126 1.542 2.126 3.989
#> sd[d15N_Pl] 0.267 0.660 0.956 1.362 2.647
#> mean sd
#> deviance 60.574 5.599
#> Zostera 0.582 0.122
#> Grass 0.077 0.028
#> U.lactuca 0.152 0.098
#> Enteromorpha 0.189 0.123
#> sd[d13C_Pl] 1.732 0.973
#> sd[d15N_Pl] 1.085 0.637
# Plot
plot(simmr_1_out, type = "boxplot")
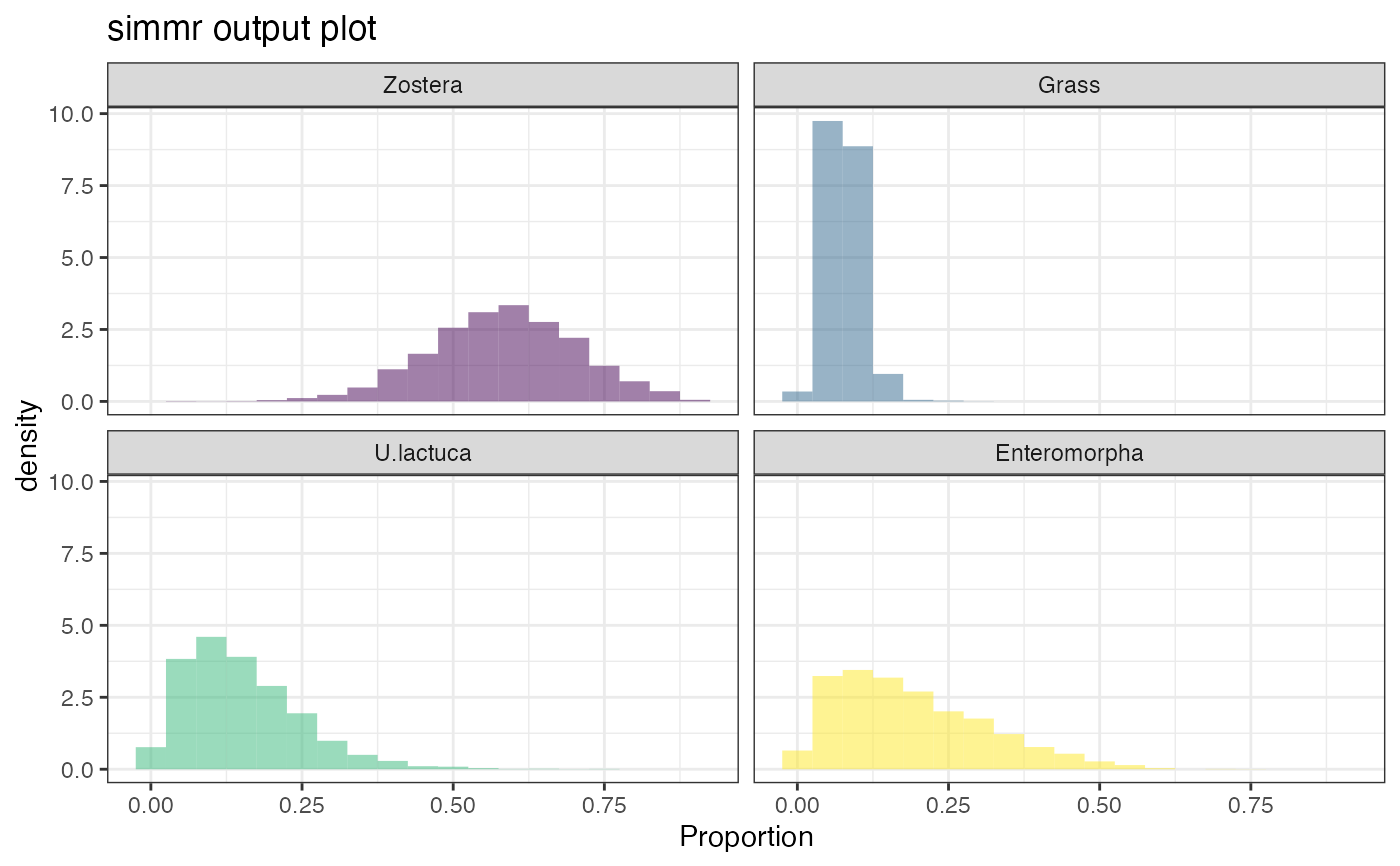
 plot(simmr_1_out, type = "histogram")
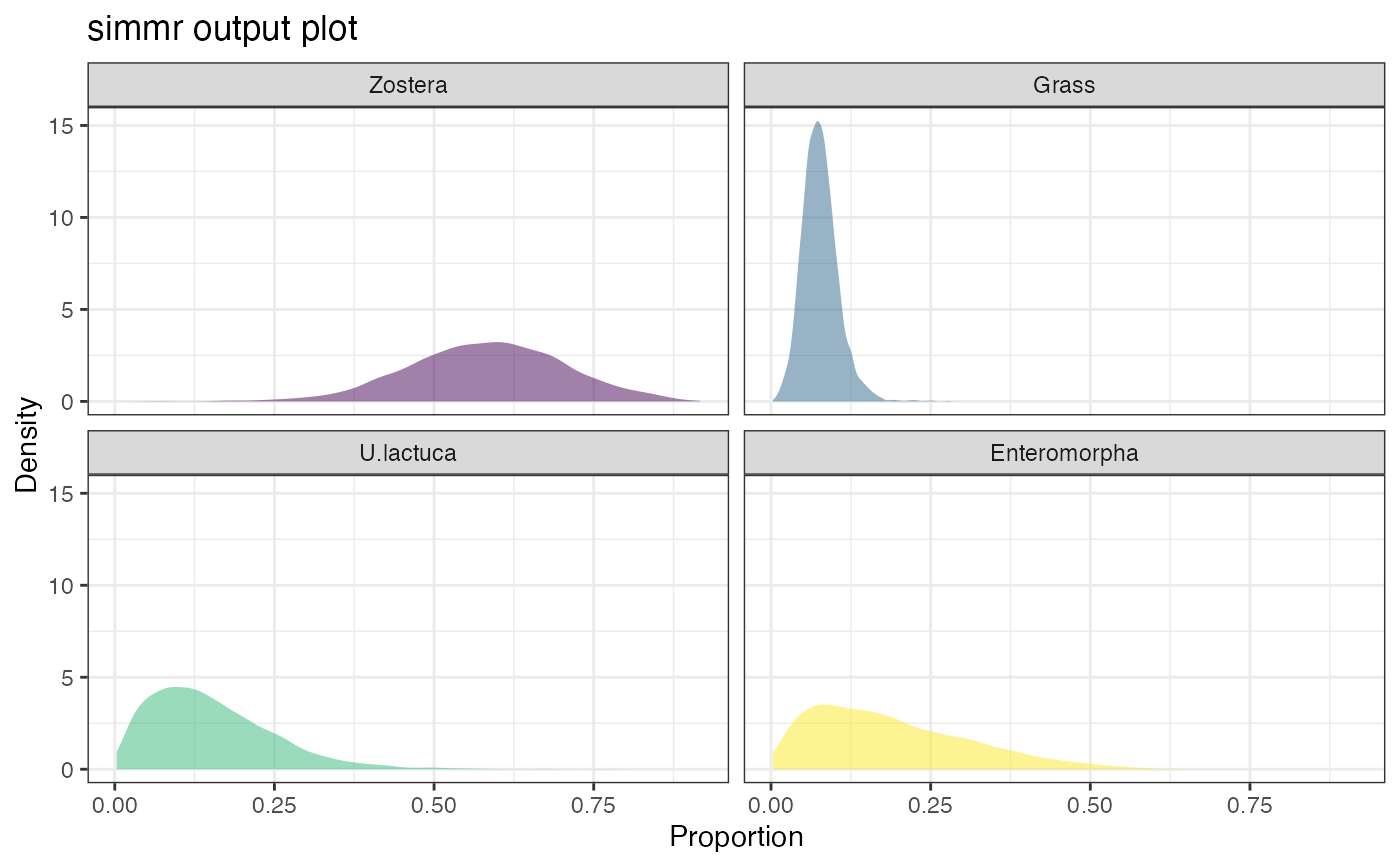
 plot(simmr_1_out, type = "density")
 plot(simmr_1_out, type = "matrix")
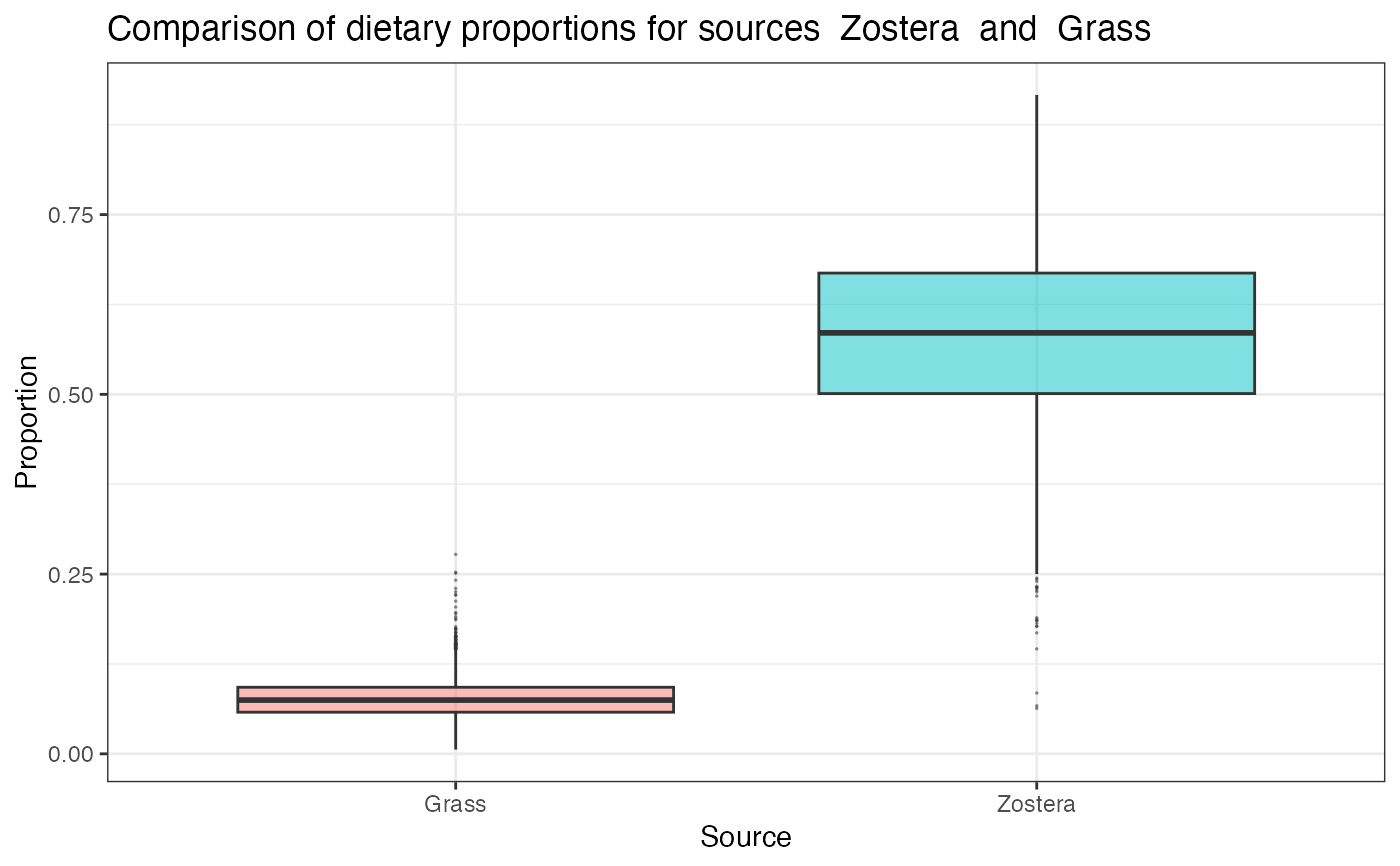
 # Compare two sources
compare_sources(simmr_1_out, source_names = c("Zostera", "Grass"))
#> Prob (proportion of Zostera > proportion of Grass) = 1
# Compare two sources
compare_sources(simmr_1_out, source_names = c("Zostera", "Grass"))
#> Prob (proportion of Zostera > proportion of Grass) = 1
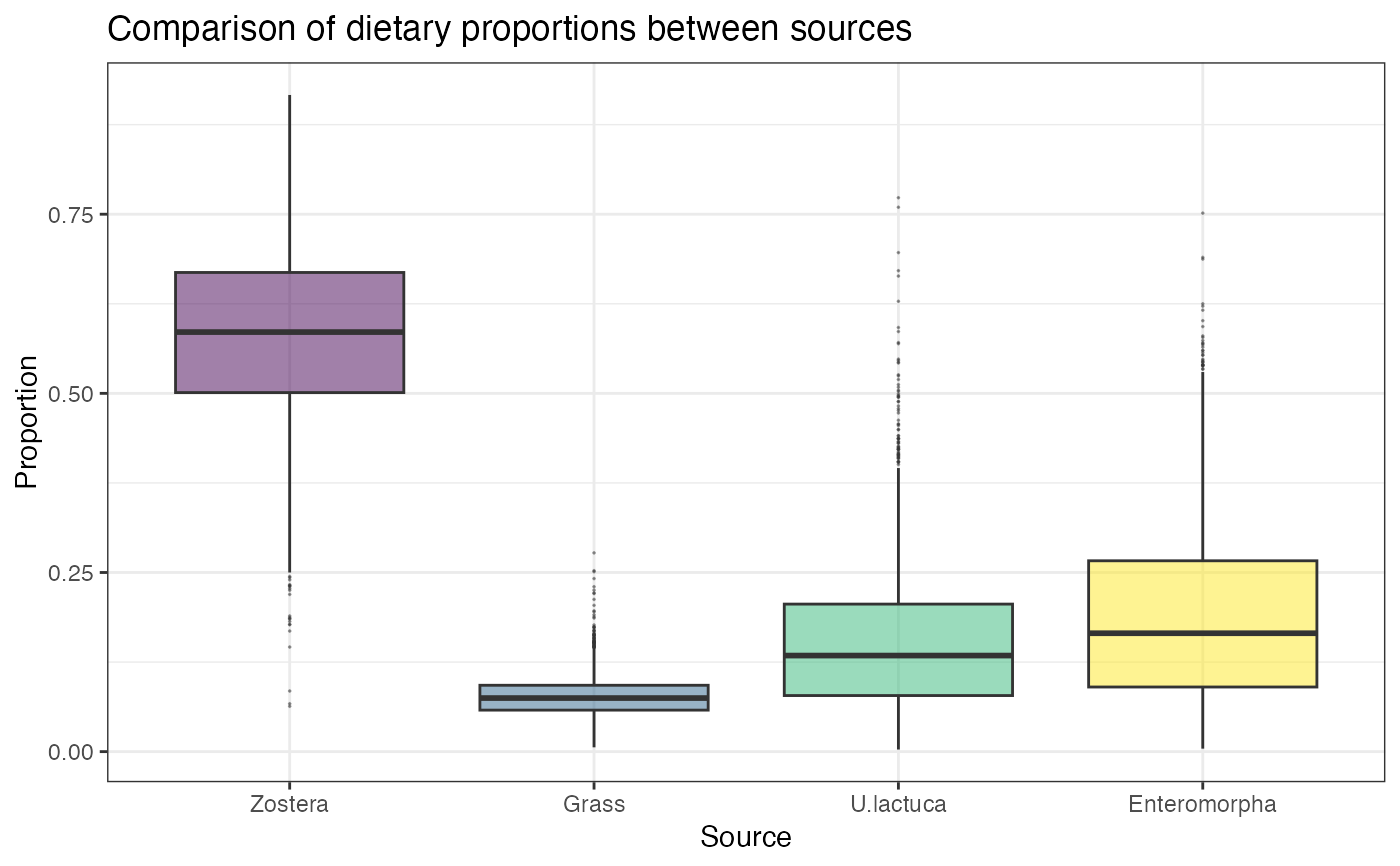
 # Compare multiple sources
compare_sources(simmr_1_out)
#> Most popular orderings are as follows:
#> Probability
#> Zostera > Enteromorpha > U.lactuca > Grass 0.3264
#> Zostera > U.lactuca > Enteromorpha > Grass 0.2203
#> Zostera > U.lactuca > Grass > Enteromorpha 0.1689
#> Zostera > Enteromorpha > Grass > U.lactuca 0.1611
#> Enteromorpha > Zostera > U.lactuca > Grass 0.0289
#> Zostera > Grass > U.lactuca > Enteromorpha 0.0272
#> Zostera > Grass > Enteromorpha > U.lactuca 0.0250
#> Enteromorpha > Zostera > Grass > U.lactuca 0.0206
#> U.lactuca > Zostera > Enteromorpha > Grass 0.0083
#> U.lactuca > Zostera > Grass > Enteromorpha 0.0083
#> U.lactuca > Enteromorpha > Zostera > Grass 0.0028
#> Enteromorpha > U.lactuca > Zostera > Grass 0.0019
#> U.lactuca > Enteromorpha > Grass > Zostera 0.0003
# Compare multiple sources
compare_sources(simmr_1_out)
#> Most popular orderings are as follows:
#> Probability
#> Zostera > Enteromorpha > U.lactuca > Grass 0.3264
#> Zostera > U.lactuca > Enteromorpha > Grass 0.2203
#> Zostera > U.lactuca > Grass > Enteromorpha 0.1689
#> Zostera > Enteromorpha > Grass > U.lactuca 0.1611
#> Enteromorpha > Zostera > U.lactuca > Grass 0.0289
#> Zostera > Grass > U.lactuca > Enteromorpha 0.0272
#> Zostera > Grass > Enteromorpha > U.lactuca 0.0250
#> Enteromorpha > Zostera > Grass > U.lactuca 0.0206
#> U.lactuca > Zostera > Enteromorpha > Grass 0.0083
#> U.lactuca > Zostera > Grass > Enteromorpha 0.0083
#> U.lactuca > Enteromorpha > Zostera > Grass 0.0028
#> Enteromorpha > U.lactuca > Zostera > Grass 0.0019
#> U.lactuca > Enteromorpha > Grass > Zostera 0.0003
 # }
# }