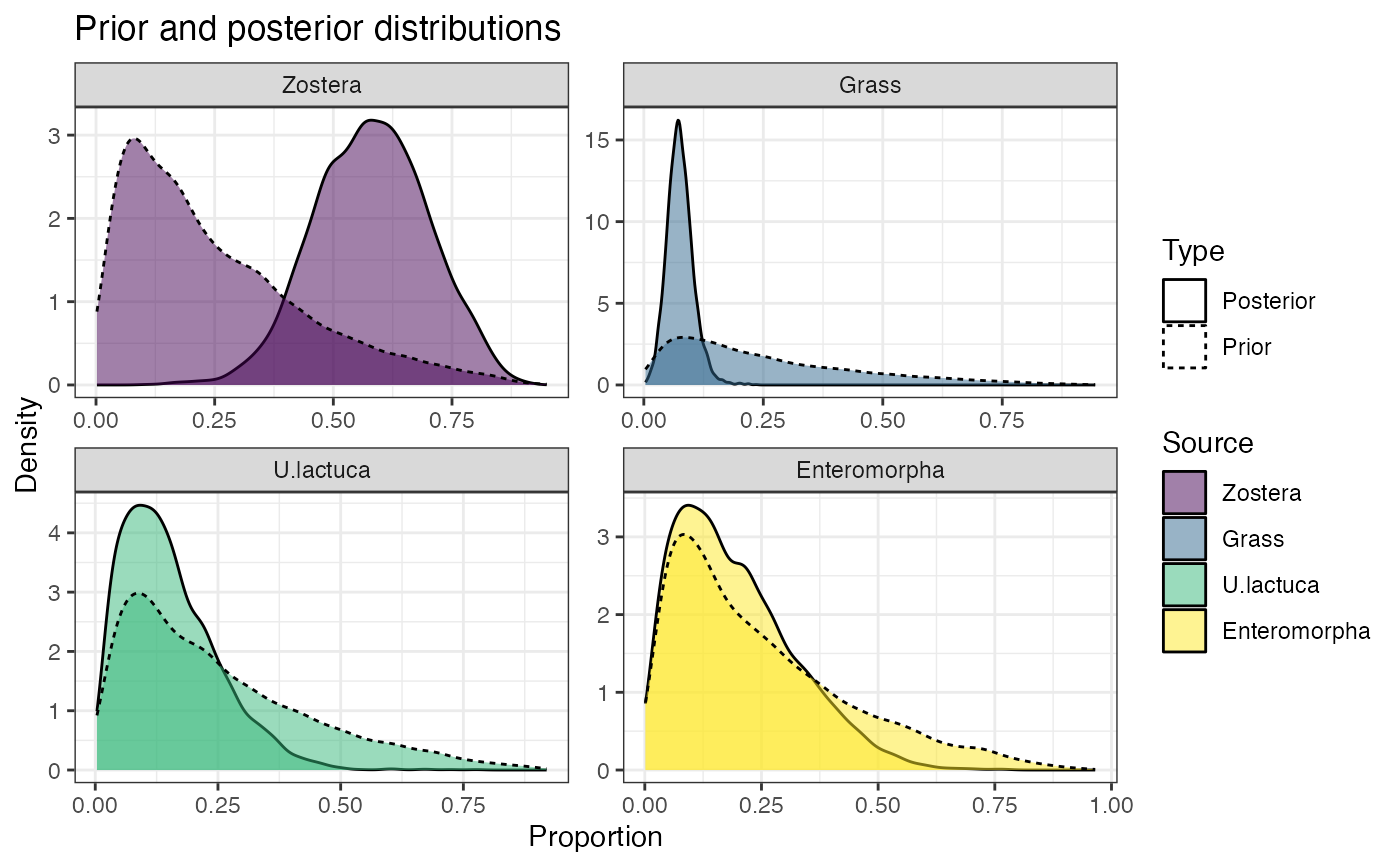
This function takes the output from simmr_mcmc or
simmr_ffvb and plots the prior distribution to enable visual
inspection. This can be used by itself or together with
posterior_predictive to visually evaluate the influence of
the prior on the posterior distribution.
prior_viz(
  simmr_out,
  group = 1,
  plot = TRUE,
  include_posterior = TRUE,
  n_sims = 10000,
  scales = "free"
)
Arguments
- simmr_out
A run of the simmr model from
simmr_mcmcorsimmr_ffvb- group
Which group to run it for (currently only numeric rather than group names)
- plot
Whether to create a density plot of the prior or not. The simulated prior values are returned as part of the object
- include_posterior
Whether to include the posterior distribution on top of the priors. Defaults to TRUE
- n_sims
The number of simulations from the prior distribution
- scales
The type of scale from
facet_wrapallowing forfixed,free,free_x,free_y
Value
A list containing plot: the ggplot object (useful if requires customisation), and sim: the simulated prior values which can be compared with the posterior densities
Examples
# \donttest{
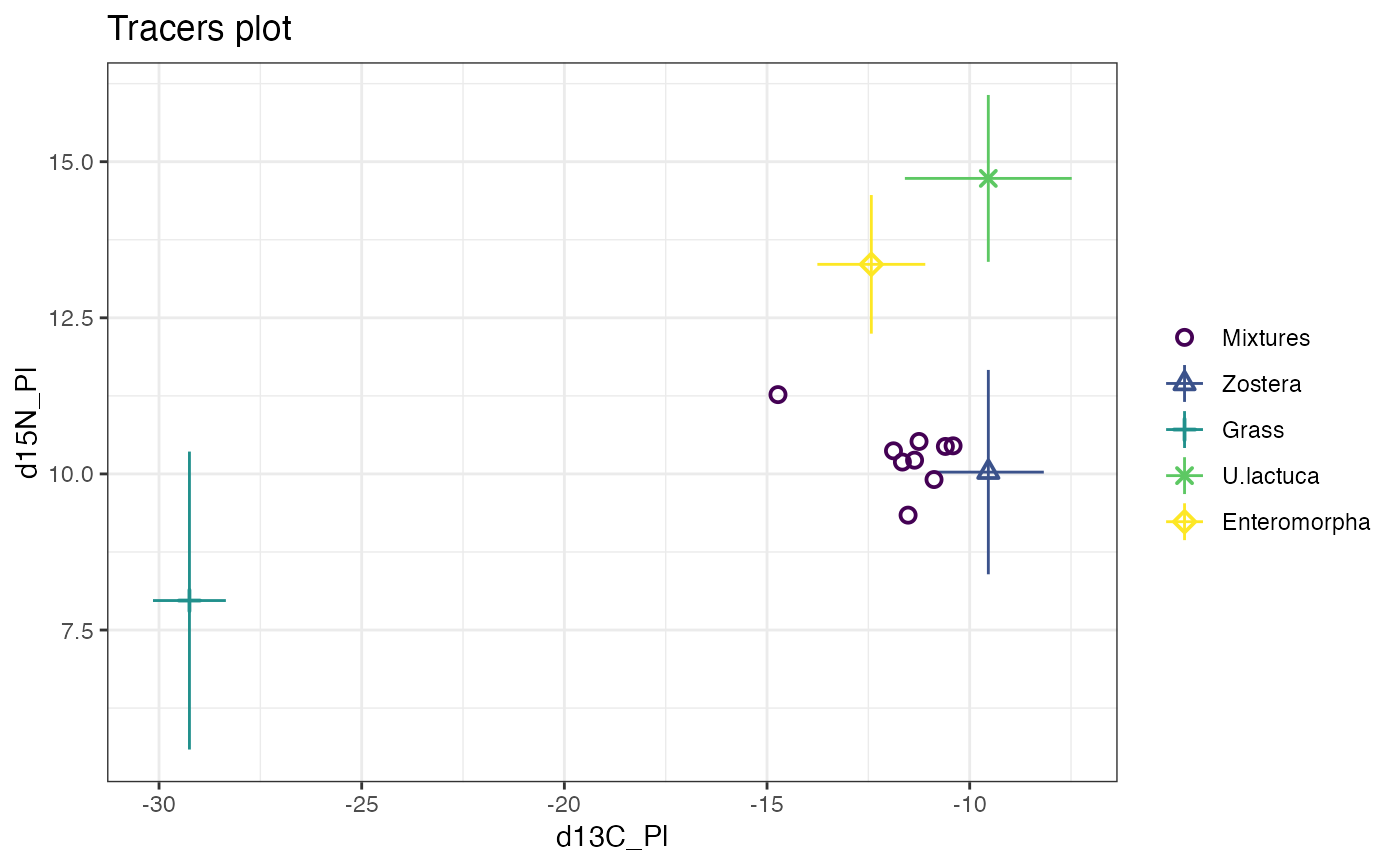
data(geese_data_day1)
simmr_1 <- with(
geese_data_day1,
simmr_load(
mixtures = mixtures,
source_names = source_names,
source_means = source_means,
source_sds = source_sds,
correction_means = correction_means,
correction_sds = correction_sds,
concentration_means = concentration_means
)
)
# Plot
plot(simmr_1)
 # Print
simmr_1
#> This is a valid simmr input object with
#> 9 observations,
#> 2 tracers, and
#> 4 sources.
#> The source names are:
#> [1] "Zostera" "Grass" "U.lactuca" "Enteromorpha"
#> .
#> The tracer names are:
#> [1] "d13C_Pl" "d15N_Pl"
#>
#>
# MCMC run
simmr_1_out <- simmr_mcmc(simmr_1)
#> Compiling model graph
#> Resolving undeclared variables
#> Allocating nodes
#> Graph information:
#> Observed stochastic nodes: 18
#> Unobserved stochastic nodes: 6
#> Total graph size: 136
#>
#> Initializing model
#>
# Prior predictive
prior <- prior_viz(simmr_1_out)
# Print
simmr_1
#> This is a valid simmr input object with
#> 9 observations,
#> 2 tracers, and
#> 4 sources.
#> The source names are:
#> [1] "Zostera" "Grass" "U.lactuca" "Enteromorpha"
#> .
#> The tracer names are:
#> [1] "d13C_Pl" "d15N_Pl"
#>
#>
# MCMC run
simmr_1_out <- simmr_mcmc(simmr_1)
#> Compiling model graph
#> Resolving undeclared variables
#> Allocating nodes
#> Graph information:
#> Observed stochastic nodes: 18
#> Unobserved stochastic nodes: 6
#> Total graph size: 136
#>
#> Initializing model
#>
# Prior predictive
prior <- prior_viz(simmr_1_out)
 head(prior$p_prior_sim)
#> Zostera Grass U.lactuca Enteromorpha
#> [1,] 0.20070423 0.18363495 0.53669789 0.07896293
#> [2,] 0.61953581 0.08033049 0.03936815 0.26076554
#> [3,] 0.51473498 0.04340801 0.14772533 0.29413168
#> [4,] 0.16616109 0.33314262 0.43534939 0.06534690
#> [5,] 0.06308184 0.72766333 0.05886188 0.15039295
#> [6,] 0.22535115 0.09985581 0.49918481 0.17560824
summary(prior$p_prior_sim)
#> Zostera Grass U.lactuca Enteromorpha
#> Min. :0.00193 Min. :0.003437 Min. :0.003398 Min. :0.001426
#> 1st Qu.:0.09887 1st Qu.:0.100335 1st Qu.:0.101007 1st Qu.:0.099005
#> Median :0.19787 Median :0.199266 Median :0.202569 Median :0.199167
#> Mean :0.24899 Mean :0.251589 Mean :0.249707 Mean :0.249713
#> 3rd Qu.:0.35415 3rd Qu.:0.360822 3rd Qu.:0.355151 3rd Qu.:0.356805
#> Max. :0.94942 Max. :0.944411 Max. :0.919671 Max. :0.965063
# }
head(prior$p_prior_sim)
#> Zostera Grass U.lactuca Enteromorpha
#> [1,] 0.20070423 0.18363495 0.53669789 0.07896293
#> [2,] 0.61953581 0.08033049 0.03936815 0.26076554
#> [3,] 0.51473498 0.04340801 0.14772533 0.29413168
#> [4,] 0.16616109 0.33314262 0.43534939 0.06534690
#> [5,] 0.06308184 0.72766333 0.05886188 0.15039295
#> [6,] 0.22535115 0.09985581 0.49918481 0.17560824
summary(prior$p_prior_sim)
#> Zostera Grass U.lactuca Enteromorpha
#> Min. :0.00193 Min. :0.003437 Min. :0.003398 Min. :0.001426
#> 1st Qu.:0.09887 1st Qu.:0.100335 1st Qu.:0.101007 1st Qu.:0.099005
#> Median :0.19787 Median :0.199266 Median :0.202569 Median :0.199167
#> Mean :0.24899 Mean :0.251589 Mean :0.249707 Mean :0.249713
#> 3rd Qu.:0.35415 3rd Qu.:0.360822 3rd Qu.:0.355151 3rd Qu.:0.356805
#> Max. :0.94942 Max. :0.944411 Max. :0.919671 Max. :0.965063
# }